Monday, June 07, 2010

GBPUSD#2

Am I being biased or what? That I keep thinking everything is going down this week? What if a reversal is on the card like what Namikumo predicts? Anyway, it's a learning process.


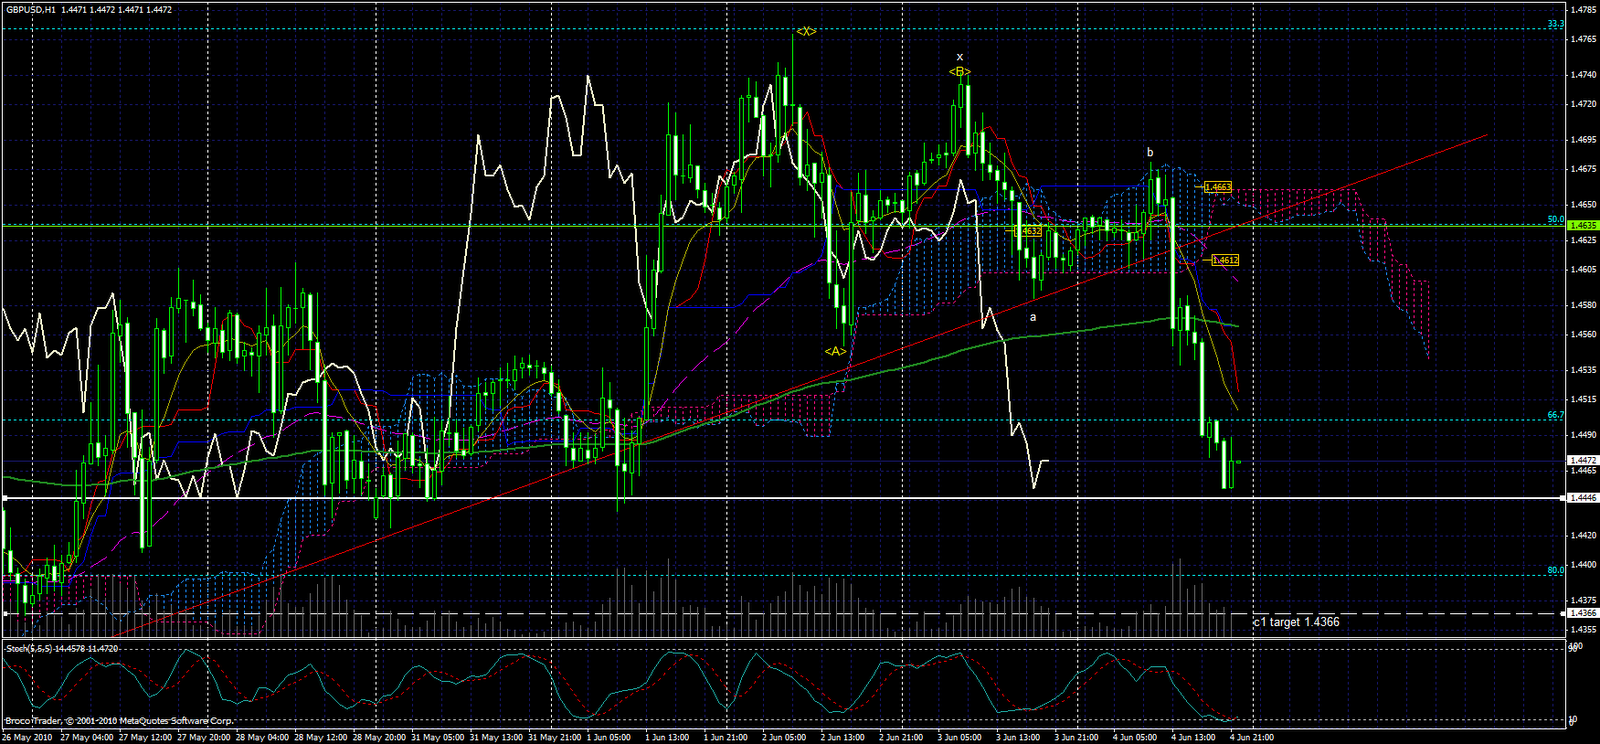
GBPUSD has broken the trendline, so I simply take it as a sign of going down. (note: yes, it can be pulled back into the trendline, or bounce up to hit the trendline before it goes down again)

Both Yellow C1 and Small White C1 are not completed yet, with targets of 1.4308 and 1.4366, respectively.

However, in the 4H chart the price is sitting on the top of the cloud while the Chikou is right on the price action. It's really an unsure situation. Will the price bounce up and bring the Chikou off the price action for the time being, or will the Chikou pierces thru the price and bring the price action down and out of the cloud? Kijun-sen can be a resistance for the Chikou at 1.4446 (note: another Chikou support line)


I'm expecting a upward retracement, and then a downward movement to complete the current wave before another direction comes up. Small White C1 target of 1.4366 is a more realistic target, which might coincide with Chikou hitting cloud bottom. Then J is formed? Then retrace up to form K? wow... that's so ideal... too good to be true.

~~

Sunday, June 06, 2010

EURUSD#4


EURUSD pair has been adhering to the wave theory very faithfully. It closed exactly at the forecasted 1.1965 last week! I need to persuade myself to believe more in the wave.

That means, current C1 rally is qualified to be called complete, though it can be a larger extension. If it's a complete wave, then a retracement up to 1.2085 is likely to happen this week to form a smal k (note: a very subjective personal feeling is, it might retrace only 1/3 as per Elliott Wave instead of 1/2, which is about 1.2043. Talking about 'personal feeling' in trading market?? Let's see?)


I put a weekly chart here with the ATR indicator, to show that in the past 2 weeks EURUSD has been trading in the range of 400 pips weekly, both with short head but rather long body. If the trend extends to this week (note: past 2 weeks' head:body:tail ratio were 10:270:120 and 80:310:10) then maybe this week will show a short head also? Not sure this kind of assumption makes any sense at all though. Anyway, a 80 pips head will hit 1/3 retracement, and a 120 pips head one will hit 1/2 retracement. I shall watch out closely when the price moves around these 2 region. If there are other clear signal, I might enter a trade, with a SL of a higher retracement level (theoretically 30 pips, might be more due to price actions).

Anyway, if price goes down straightaway tomorrow, I hope I can just stay out of it until some clear signals surfaced. Another subjective judgment is, 1.1874 and 1.1704 to be resistance zone? Well...I can say anything on a weekend, which might turn out to be laughable when the market wakes up :P

~~

AUDUSD#1


I guess AUDUSD will continue to go south this week, but perhaps not immediately. Just like mentor always says, the shadow has to be formed first. Looking at 1H chart, Stochastic is going to turn up, so perhaps it will go up tomorrow, at least in the first few trading hours. 1/3 retracement of the Blue B is possible? Meaning can go up to 0.8299? Shall watch the price movement, I have no experience in making a guess. If the wave calculation is right, the immediate target of Blue C1 is 0.8159. White lines are what I labeled as the Chikou support line (note: I think it's my very subjective interpretation??). If price (and Chikou) breaks the support range ...ahem..."convincingly", it might go down "convincingly".


Looking at the weekly chart, price action is now in a thick cloud. Weekly EMA200 can be a resistance for both price and Chikou. In terms of price, the EMA200 is around Blue C1 target, while for Chikou, it's Red T wave target 0.7971. Don't expect the price to complete the bigger Red T wave so early in the week though.

Stop loss? Hm...a very big thing to decide. I think 0.8310? It's a little far from current price action, almost 100 pips! Why 8310? It's 1/3 retracement from current rally, and also a flat Kijun in 4H chart that might stop the Chikou from going up. I need to consult some opinions on this :D

~~

GBPUSD#1 - Missed Rally

I was watching this pair very closely when the before the big rally down. Literally keep an eye on it, as if all ready to be called into action if needed. But then came the real battle, what happened was I stayed sideline as a spectator throughout, even though there were many signals and perhaps a few opportunities presented.


Looking at the 1H chart above, first, the red trendline was broken, a trendline that has held for more than a week. When the trendline was being broken, the Chikou Span was dipping into the thick cloud, giving me the thought that it might be a strong resistance. Another thing was, there was the EMA50 (pink dotted) below the price, could be another resistance.

That also coincided with EMA200 (green line) in the 1H chart below. In the 1H chart, Chikou had broken the thick cloud as well. A clear and usually true bearish signal. The price indeed hit some resistance around H1 EMA200, which was probably another opportunity to enter, but I held back the urge, thinking it would bounce up to around cloud bottom. I actually placed an order to short at cloud bottom by then, but it was being done.

I'm not ruing the missed opportunity, but rather, a post-mortem. Should I have entered? Was I being too conservative or it was actually a right move to stay out? Or I was simply didn't study the signals enough, that's why I didn't have the confidence?

Reasons to enter:
1. Wave movement clear
2. Trendline broken
3. Chikou broke thick cloud
4. Price came out of thick cloud
5. Tenkan-Kijun crossed
6. Chikou broke its own Chikou support line (note: I realised after a reasonably long period of sideway movement, this Chikou support line or whatever it's called is a very good support/resistance range, once violated, the consequence is hefty)


I was grateful also, perhaps it was because it wasn't in a trade that I could objectively watch and observe the market movement, without too much emotional disturbance.

A blog post is not sufficient to record everything I've learn this night. But I'm glad I witnessed such an eventful night, which saw EURUSD and AUDUSD moved in similar behaviour, and DJI also closed below 10000. I'm looking forward to next week.

~~

Saturday, June 05, 2010

EURUSD#3

Another back-dated post, on what happened on 3 June 2010.

I label the current EURUSD chart as the following, on 3 June night, it's about the second candle after the yellow B:


Knowing it's very likely to be a white L1 wave down, I want to look for an opportunity to enter the ride.


Both 1H and 30m charts have price action and Chikou Span moving above the very thin cloud. It has been a steady trend down from the Yellow B point, the possibility of price piercing through the cloud was higher than the cloud bouncing the price back up. Furthermore, in 4H chart the Chikou span was also already below price, a sign or bearishness.


Price briefly tested kumo on the 30m chart, but it closed some pips above it, which cause the Chikou to pierced through the cloud, it sent my pulse running of course, but I told myself to watch the next candle. That was rather typical "fake move"? Not sure. Come the next candle, it broke the cloud quite convincingly (note: what does it mean "convincingly"?? was it my own subjective interpretation? psychology? biased judgment? or maybe all of the above. Surely not based on experience 'cos i have none) so I entered the trade @1.2219 (green line), SL @1.2234 (red dotted line). The reason of the tight stop loss was, it was already quite a big candle when I entered. So if it pulled back to my SL point, there's a possibility of forming a long hammer-like candle, which might mean another fake signal. (note: of course, it can swing up and down a few times but still form a big black candle in 30min!)

Anyway, once the downtrend was confirmed (big long black candle finally completed, closed way below Kumo), I continued to watch the movement (note: as an inexperienced player, that's the way I feel "secure").

I referred to the Slow Stochastic movement to decide whether I should come out of the trade. there was one white candle, one black, and another white after the big black candle, but the Stochastic was still going down steadily, so I let it ride. Until the hammer formation, which coincide with the turning of the Stochastic, so, closed the trade. My first winning trade :) cheers.

Some side notes:
When I was sitting on some floating profit, I was thinking about moving my SL or maybe put a trailing stop (as it was late at night, I didn't think it was a good idea for a noob to sleep with an open position).

Then there were some scenario:
1. Assume the ride from Yellow B to the hammer as a motive wave, the immediate Fibonacci retracement level (1/3) would be around 1.2206. I could move the SL there, but then it's just 13 pips from my entry, and with my initial SL of about 14 pips, it didn't even make a 1:1 trade! So I decided against it. (note: reviewing it now, it really retraced about 1/3 before a even bigger rally down)

2. Maintain the stop loss. Again, to have an open position wasn't cool. (note: review again, if I maintained the SL...IF...BIG IF....)

3. Close the position, call it a day. Yes, I thought it was a good learning trade, so I closed the trade a while after the hammer was formed.

My first winning trade, but I won't say it was perfect because several things could have happened and to take note:
1. If the initial price swing was bigger, I could be stopped out before it continued it's downward rally as my SL was very small.
2. Was it wise to close the trade instead of maintaining the initial stop loss? (put aside what happened after that, but simply, what was better? Close trade? Keep the trade?)

~~

EURUSD#2

This is a back-dated post.

I came across this chart formation the next day (3 June):


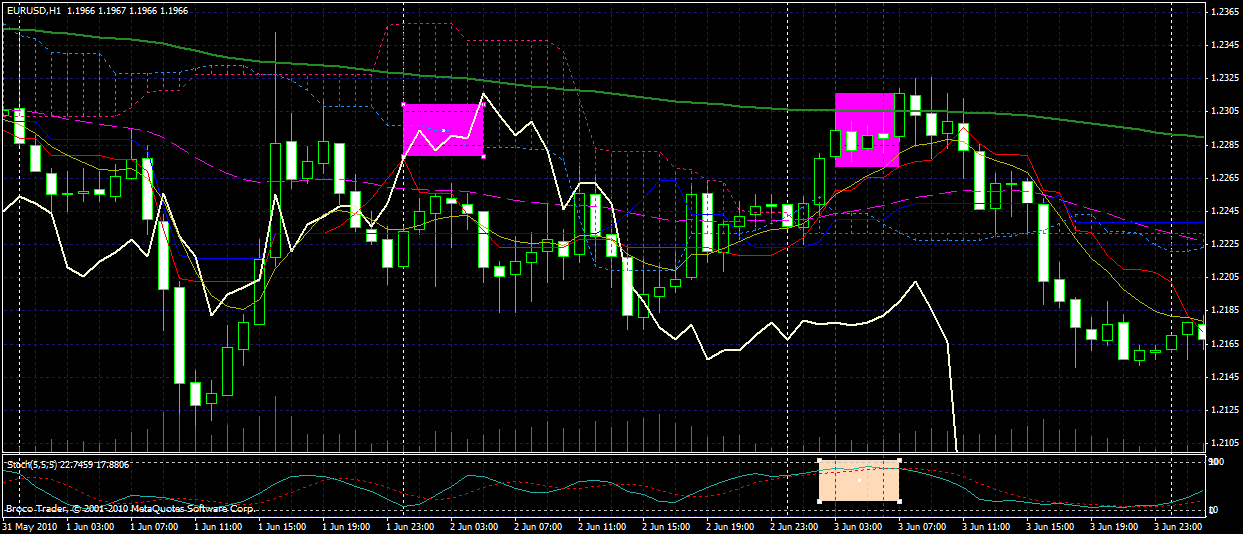
First, I noticed two antennas of the same heights formed on a 30m chart. That was coupled with the weakening Slow Stochastic on the same chart.


Meanwhile, on 1H chart, it seemed EMA200 (green line) was a resistance to the price action. So, I entered the trade @1.2289, and SL at 1.2325.

The outcome? I was again stopped out almost immediately :-(

The lessons learnt was, even though antennas were formed and price seemed to hit a EMA200 resistance, but other indicators didn't show very clear signal. The Chikou Span, for instance, was just testing the cloud in 1H chart, there was some possibility that it will bump up and down before its direction was confirmed.

A hindsighted review on this trade, it's shown that I was a few pips of SL away from catching a good ride down. Looking at the 4H chart below, perhaps I should use consider the Kumo as the resistance, and therefore allow a larger stop loss to accommodate price fluctuation around Kumo bottom. Kumo bottom is also a two-third retracement from the high on 28 May.


~~

Wednesday, June 02, 2010

First Trade EURUSD#1


Saw a triple bottom at 30m EURUSD chart, and looking for a chance to short it if it were to break the triple bottom support. Entered the trade as soon as the black candle piercing the bottom closed, with a 15-pip SL.

No surprise, I was stopped out very soon after that :P

Lessons learnt: always wait for retracement, play safe! Also, looking at Slow Stochastic, it didn't show a clear signal of turning down. Instead, it was in the middle of nowhere, and perhaps showing signs of turning up! To be honest, i didn't do enough study on this before entry. Only a brief look at chart, and the itch of getting into a trade got the better of me.

First trade, a losing one :)


~~

I'm in, the £ive! World

It's been about a year since I was being introduced to forex, or more generally, derivatives trading.

It's been more than three months since I started trading on a demo account.

And finally, I've got a live trading account loaded with a tiny fund.

So, I'M IN! Just like Neo announced to the Matrix.

My mentor has been advising me to keep a trading journal, as a commitment in this learning process.

I don't know how successful or unsuccessful I would be.
I don't know if my tiny fund still intact after trading for 3 months .
I don't know if I'll make silly decisions from time to time.
But I keep a journal to record my learning, to jot down advices and opinions I receive, to share thoughts and comments I come across, and, perhaps most importantly, to keep myself accountable to this space so that I plan my trade, trade my plan; talk the word, walk the talk.

~~