Showing posts with label gbpusd. Show all posts

Thursday, June 16, 2011

20110616 - Trade Plans

GBPUSD


Bullish Bat pattern, however entry is placed just above 100% instead of at 88.6%, otherwise the SL will present too large a risk to cover the next support.

Entry 1.6076
SL 1.6031
TP1 1.6230
Trading Buddy Scale 8


NZDJPY


Bullish Butterfly pattern, coincides with 2 more Fibonacci levels. Entry placed at 127% retracement.
Entry 64.25
SL 63.90
TP1 64.90
Trading Buddy Scale 8


NZDUSD


Another Bullish Butterfly pattern.
Entry 0.7990
SL 0.7945
TP1 0.8060
Trading Buddy Scale 6

~~

Tuesday, May 03, 2011

20110503 - GBPUSD Trade


Bullish Butterfly formed on 1H chart, PRZ converges around 1.6590. Making day shadow around 60pips, though it's so early in the morning to confirm it say day shadow.

Entered short at 1.6588, SL 1.6538 (50pips), 4H chart just below EMA50. Target 1.6670 (61.8% retracement of CD).

Another risk is, it could be a bigger bullish bat, which will be completed at around 1.6527.

~~

Thursday, March 31, 2011

20110331 - GBPUSD Plan

Bearish Bat formed, with Potential Reversal Zone between 1.6105 to 1.6130.
Alternate Bearish Bat limit is at 1.6166.

Plan entry at 1.6142 to short on Bearish Bat, also day shadow ~74pips.
SL 40pips at 1.6182.
TP is 61.8% retracement of run, at 1.6020.


~~

Wednesday, March 30, 2011

20110330 - GBPUSD Bearish Butterfly


Trading Buddy,

Here you go:


Bearish butterfly formed on 30m chart, rather ideally. PRZ 1.6052, 1.6058, 1.6068. When see the chart, PRZ already tested, and price had retraced to slightly below 1.6052. PRZ also coincide with day shadow (74pips). Placed entry at 1.6060, got matched. TP 1.6016 (61.8% retracement of CD). SL 1.6085, which is slightly above day high.

Moved SL to 1.6059 after having 30pips floating profit. Hit target and closed position.

Not big, but hope can find consistency :)
~~

Monday, October 18, 2010

GBPUSD#17 - Weekly Homework

Yes, it did come down. But no, it didn't end the week as a black candle.

On the weekly chart, price action has broken above the previous high set back in August, but it actually didn't close above the previous high. The week ended with a spinning top. Still rather unsure! Chikou broke above EMA50, attempted to breach the cloud but failed. Take FB retracement from August 2009 and November 2009, two major resistances at FB67, which are 1.6110 and 1.6010, respectively.

On the daily chart, though a bearish antenna was formed, it's not wise to short this pair too aggressively to be safe, as Ichimoku indicators haven't give signals of weakness. Adventurous play though, can be to short it from 1.6065, with SL covering at least 1.6110.

4-hourly chart, also still bullish signals at least for the time being. However, with thin cloud ahead, a reversal can be rather sharp if it does happen.

In a nutshell:
R3: 1.6350 (FB80)
R2: 1.6110 to 1.6143 (FB67 and Chikou support)
R1: 1.6065

S1: 1.5945 (Chikou support)
S2: 1.5800 to 1.5830 (previous resistance turned support)
S3: 1.5570

~~

Sunday, October 03, 2010

GBPUSD#16 - Weekly Homework


[Weekly Chart]

A doji was formed last week, also saw Chikou failed to break above flat Kijun. It also closed just below fb80 from August's high. Probably a sign of another XAB is formed. Generally, weekly sentiment is a little unsure.


[Daily Chart]

As Trading Buddy pointed out, no candle manage to close above 1.5833 level (week Flat Kijun). Those long candle shadows indicate uncertainty and tug-of-war between the bull and the bear, with bear appear to be slightly stronger for now. However, the last candle was a bullish engulfing.


[4-hourly Chart]
Just to further zoom in to see the uncertain trend. Even Tenkan is overlapping right on the Kijun now.

In a nutshell:
Uncertain trend, with many supports and resistances to watch out for. Sentiment is more bearish-inclined until the previous high (1.5997) is broken.

R2 - 1.5997 (previous high)
R1 - 1.5920 to 1.5945 (last week's high, previous Chikou support)

C - 1.5800 to 1.5833 (4H Chikou support and Weekly Kijun flat)

S1 - 1.5665 (last week's low0
S2 - 1.5570

~~

Sunday, September 12, 2010

GBPUSD#15 - Weekly Homework

Weekly chart has seen candle come out of the cloud. It seems retracement is not yet complete for a bullish motive wave from end of May to the beginning of August. Weekly candle closed slightly below FB33 retracement and back into the downward channel again, might go down further to test FB50 retracement (1.5115) which coincides with Kijun-sen, or the bottom of the cloud on the daily chart (1.5170).

Currently price is in a range between 4-hourly EMA200 and a support range between 1.5290 and 1.5350.

R2 - 1.5520 (previous support-turn-resistance)
R1 - 1.5460 (4-hourly Kumo Top) or 4-hourly EMA200

S1 - range between 1.5290 and 1.5350
S2 - range between 1.5170 (daily kumo bottom) and 1.5115 (fb50 retracement)


~~

Sunday, September 05, 2010

GBPUSD#14 - Weekly Homework


[Monthly Chart]
Last month finished forming a dark cloud. This month, after over 3 trading days, looking to be forming the top shadow of a black candle? Too early to say anyway.


[Weekly Chart]
It has been 3 consecutive weeks of rather small range, and small body. though it's been making a slow down trend, short bodies might signifies uncertainties. Anyway, it's broken below EMA50, being supported by Kumo Bottom.


[Daily Chart]
Price has been moving in a bearish channel. However, a bullish cloud is immediately ahead. Price might enter Kumo and bounce up.


[4-hourly Chart]
EMA50 continues to be the trend definition since August.

In a nutshell:
R2 - 1.5576 (previous week high)
R1 - 1.5520 (previous support turned resistance)

S1 - 1.5325 - 1.5340 (previous week low)
S2 - 1.5170 (daily chart kumo bottom)

EMA200 and EMA50 are always helpful indicators of support and resistance too.

~~

Sunday, August 22, 2010

GBPUSD#14 - Weekly Homework


[Monthly Chart] - GBPUSD is making up a dark cloud cover pattern this month. with 7 to 8 trading days remaining in August, I do not expect it to reverse the formation. There's no big figures pending this week that might drive it up so drastically. Which also means, no big figure from the UK itself to crash it down violently?


[Weekly Chart]


[Daily Chart]

Last week has been trading within in a tight range, with 1.5550 being a very solid support, until the last day. The week closed with a black candle closing below the S1 mentioned last week, though being supported by S2, and EMA50. On weekly chart, Chikou has bounced back by price action.


[4-hourly Chart]
EMA200 support has been very solid (more so on Netdania chart). Thick bearish Kumo ahead.

In a nutshell:
S1 - EMA200 on 4-hourly Chart
S2 - 1.5460 (last week's low) to 1.5433 (daily EMA200)
S3 - 1.5340 (weekly Kumo bottom)

R1 - 1.5550 (previous support)
R2 - 1.5622 (or 4-hourly EMA50)
R3 - 1.5769 (4-hourly Kumo top)

General sentiment is bearish, with daily EMA200, and then EMA50, being crucial supports. Breaking R3 (1.5769) might mean an end to current bearish sentiment and might go for 1.6000 region.


~~

Sunday, August 15, 2010

GBPUSD#13 - Weekly Homework


Very clear bearish engulfing pattern on the weekly chart. Immediate support 1.5475 (fb33, Kijun in daily chart and EMA200 in daily chart) and 1.5340 (Kumo bottom). Chikou seems to meet price resistance. Stochastic has been waiting to come down for than a month.


Breaking of Kijun and EMA200 will mean a lot!


4-hourly chart, resistance at 1.5733 (fb50 retracement of Tenkan-Kijun crossing) and 1.5769 (Kumo bottom).

R1 - 1.5733
R2 - 1.5769
R3 - 1.5997 (recent high, breaking of which will signal the end of bearish retracement)

S1 - 1.5550
S2 - 1.5472
S3 - 1.5340

~~

Tuesday, July 13, 2010

GBPUSD#12 - Day Homework


GBPUSD didn't drop as much as initially expected. What about this now? Still can't catch it's behaviour.

Still will watch out when it nears double-top. There seem to be a strong resistance there.

Short entry possible at 1.5240 - 1.5275. SL 30 - 50pips


~~

Monday, July 12, 2010

GBPUSD#11 Weekly Homework


In the daily chart, GBPUSD seems to be moving within a range with last week's high and low as boundaries. There's a good chance it might continue to move in that pattern in the early week. As Trading Buddy said, it might be good chance to play within the S&R range.

It may still hit the high of between 1.5240 (fb80 from Big White B) and 1.5270 (Big Red L1 target).


Look at the 4-hourly chart, even though the price has been bouncing above the cloud last week, but last week's close saw Chikou finally broken below the price. It's a weak bearish sign because it cross the price above the cloud. Another reason to think it will go sideway.

Another scenario is, the price to drop to the flat top of the cloud (around 1.4870, also fb67 from last week's high in the daily chart), or flat kijun (around 1.4795, or fb50 retracement from bigger wave from the low of 8 June), before going up. Can look for chance to long at these 2 regions.

A good place to short will be EMA200 in the daily chart, around 1.5400. Shall observe more in the coming week.


~~

Monday, June 21, 2010

GBPUSD#10 - Day Homework


After breaking a little above last week's high, GBPUSD is on course for a fb67 retracement from recent high. Don't expect it to move tamely to TP of 1.4710 though.

~~

GBPUSD#9 - Weekly Homework


I believe Red C2 retracement is not done yet, though last week it briefly touched a fb67 from the high of 1.4886.

In day chart, an antenna was formed. Chances of going down on Monday is high. Immediate target is EMA200 on 4H chart (1.4713), 1.4676 (fb67). J, K will build up after that.

However, if it opens and breaks above last week's high, the next target is around 1.5109, the first possibility of forming a Big Green L2.

~~

Thursday, June 17, 2010

GBPUSD#7


GBPUSD hit TP of 1.4854 last night and started to come down immediately.

A possible retracement is FB67, where Chikou is going to hit the bottom of the cloud and around EMA200 on 1H chart. It's also 20 pips below flat Kijun on 4H chart. Shall watch out for the market direction around that region.

Plan:
1. If 1H price bounces up to 1.4703 (EMA200 on 4H), wait for price to close outside cloud to short, TP 1.4655. But I'll have to see then where a reasonable SL should be, and calculate the possible risk:reward ratio. A no go if it's less than 1:2

2.If price fall to 1.4655, watch out closely if it shows sign to bounce up or going further down. For short, SL around EMA200 on 1H chart, TP 1.4555.
 

~~

Sunday, June 13, 2010

GBPUSD#5 - Weekly Forecast


Strictly speaking, from day chart, Big Lime L1 is not finished yet, about 20pips short of WTP. But, technical analysis is more of an art than science isn't it? Let's see.


By the way, White R, S still valid. Kijun-sen is also still valid in day chart, to reject the upward movement. The same is true in 4H chart.


4H chart, Tenkan had crossed above Kijun last week, so a short term uptrend can be expected.
Chikou is between Kijun flat and price. Immediate resistance might be Kijun flat, which is fb67 retracement of the previous downward rally. Resistance levels:
1. 1.4590, fb67 retracement, Chikou meet Kijun flat in 4H chart
2. 1.4630, fb50 retracement, Chikou might move near top of the cloud in 4H chart, and also flat Kijun in 1H chart.
3. 1.4700, fb80 retracement, EMA200 in 4H chart

1H chart, price is moving along the cloud bottom, so any price close outside the cloud bottom will be a sign of going down.

Shall look out for reversal sign. If market started out bullish, I expect GBPUSD to take a short ride up before coming down. I think it has little upside, but plenty of room for bear run.

Looking at week chart, it seems it's rather unsure of its own direction? Be very careful, it can go anywhere!

~~

GBPUSD #4 - First Try of Using Open Order


In 4H chart, after price action bounced up after hitting cloud bottom, I was always looking out for a reversal sign (note: again, was I biased??). I identified several possibilities of resistance:

1. 2/3 retracement, approx. 1.4608
2. Top of cloud, approx. 1.4630
3. 80% retracement, approx 1.4661
4. EMA200 on 4H chart

While observing price action around the first few options, there were no clear sign of weakness (although it always showed a few fake moves). Finally I thought it should not break the EMA200, and even it does, won't be by a big margin, else it would be break the small white x. So, I placed an open short order around EMA200.

When I wake up, there wasn't anything in my "Open Position" window. But that was just because my order had been matched, and SL triggered T_T

Lesson learnt? Hm...I don't think it's so wise for a beginner like me to put an open order just like that? Not until I can forecast the market rather better.

By the way, I didn't fail to notice a nice reversal sign on 4H chart, a Dark Cloud Cover was formed! But due to technical problems, I couldn't place an order -.-

~~

GBPUSD#3 - Winning but Not Satisfying Trade


As planned in the very beginning of last week, was expecting GBPUSD to form a Big White R, S waves before T extension. Also, forecast GBPUSD to go up slightly before continuing it's rally down.

However, it happened quite the opposite - dropped a bit at the beginning of the week before a bullish run up.

As labeled in the 1H chart above, I entered the trade after the Dark Cloud Cover reversal pattern, predicting it might be the end of S wave and start of T.

It went down as predicted, and of course I was glad.


I woke up the next morning with rather satisfying (for me level) 60-odd pips. But as now shown on the chart, it was a strong bull run for 2 days. Though I didn't get my SL triggered, but I exited the trade with less than 20 pips of profit. Of course any profit can't be bad, but as a review, I think I should have exited from the trade when 4H chart showed the downward action was disrupted when the candle break the bottom of the cloud but closed as a white candle way inside the cloud. It was a sign of weak bear.

Lesson learnt.


~~

Monday, June 07, 2010

GBPUSD#2

Am I being biased or what? That I keep thinking everything is going down this week? What if a reversal is on the card like what Namikumo predicts? Anyway, it's a learning process.


GBPUSD has broken the trendline, so I simply take it as a sign of going down. (note: yes, it can be pulled back into the trendline, or bounce up to hit the trendline before it goes down again)

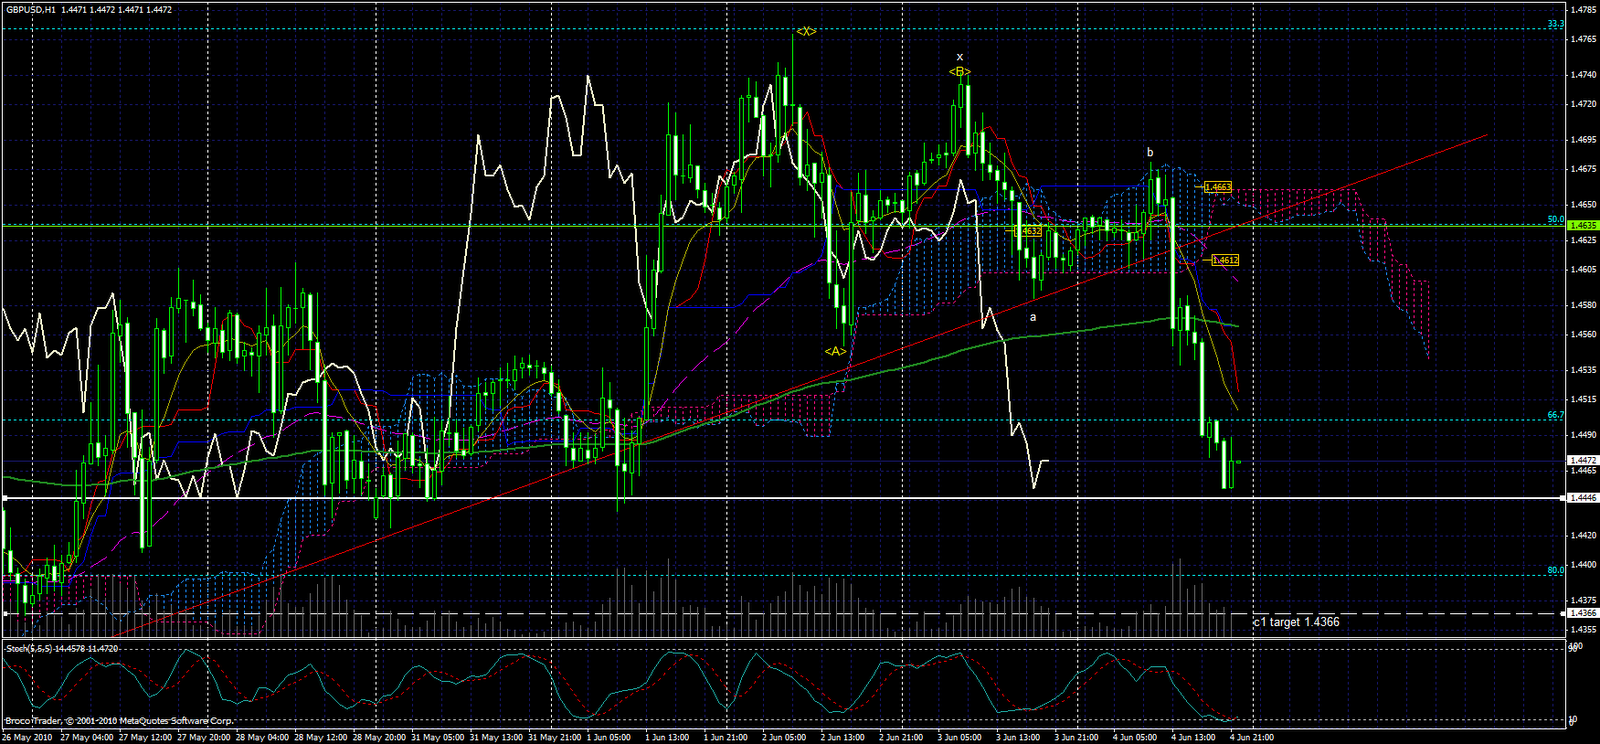
Both Yellow C1 and Small White C1 are not completed yet, with targets of 1.4308 and 1.4366, respectively.

However, in the 4H chart the price is sitting on the top of the cloud while the Chikou is right on the price action. It's really an unsure situation. Will the price bounce up and bring the Chikou off the price action for the time being, or will the Chikou pierces thru the price and bring the price action down and out of the cloud? Kijun-sen can be a resistance for the Chikou at 1.4446 (note: another Chikou support line)


I'm expecting a upward retracement, and then a downward movement to complete the current wave before another direction comes up. Small White C1 target of 1.4366 is a more realistic target, which might coincide with Chikou hitting cloud bottom. Then J is formed? Then retrace up to form K? wow... that's so ideal... too good to be true.

~~

Sunday, June 06, 2010

GBPUSD#1 - Missed Rally

I was watching this pair very closely when the before the big rally down. Literally keep an eye on it, as if all ready to be called into action if needed. But then came the real battle, what happened was I stayed sideline as a spectator throughout, even though there were many signals and perhaps a few opportunities presented.


Looking at the 1H chart above, first, the red trendline was broken, a trendline that has held for more than a week. When the trendline was being broken, the Chikou Span was dipping into the thick cloud, giving me the thought that it might be a strong resistance. Another thing was, there was the EMA50 (pink dotted) below the price, could be another resistance.

That also coincided with EMA200 (green line) in the 1H chart below. In the 1H chart, Chikou had broken the thick cloud as well. A clear and usually true bearish signal. The price indeed hit some resistance around H1 EMA200, which was probably another opportunity to enter, but I held back the urge, thinking it would bounce up to around cloud bottom. I actually placed an order to short at cloud bottom by then, but it was being done.

I'm not ruing the missed opportunity, but rather, a post-mortem. Should I have entered? Was I being too conservative or it was actually a right move to stay out? Or I was simply didn't study the signals enough, that's why I didn't have the confidence?

Reasons to enter:
1. Wave movement clear
2. Trendline broken
3. Chikou broke thick cloud
4. Price came out of thick cloud
5. Tenkan-Kijun crossed
6. Chikou broke its own Chikou support line (note: I realised after a reasonably long period of sideway movement, this Chikou support line or whatever it's called is a very good support/resistance range, once violated, the consequence is hefty)


I was grateful also, perhaps it was because it wasn't in a trade that I could objectively watch and observe the market movement, without too much emotional disturbance.

A blog post is not sufficient to record everything I've learn this night. But I'm glad I witnessed such an eventful night, which saw EURUSD and AUDUSD moved in similar behaviour, and DJI also closed below 10000. I'm looking forward to next week.

~~