Euro dropped last week, but wasn't a very huge drop. It's enough to form a black candle engulfing the previous week's body though.
On the weekly chart, price failed to break above EMA50, also means Chikou couldn't break above Kijun. Price was being supported by Kijun around 1.3185, which will continue to be the immediate support. Another stronger support observed on the weekly chart is still 1.3000. As for resistance, EMA50 (currently at 1.3420) is the immediate resistance, followed by EMA200 & Kumo flat around 1.3350. Basically, support resistance levels are similar to those mentioned last week, only the sentiment turned to be even slightly (not too much) more bearish.
On the daily chart, EMA200 successfully bounced price off it, and out of the Kumo, a sign of bearishness. Price is now moving in a flag / channel. It won't be surprise if price might rebound to as high as 1.3380 again, or even 1.3480 (EMA50, Kumo flat bottom). However, 1.3550 will be a strong resistance. Daily Tenkan (around 1.3185) proven to be a support, which coincides Chikou's attempt to pierce through the thin Kumo. For the time being, Chikou has rebounded after touching the bottom of the thin Kumo. Once broken 1.3183, a strong bear run might continue, though 1.3000 will be another support
On the 4-hourly Chart, 1.3185 is the immediate support, successfully supported the price last week. However, with a bullish cloud ahead, it might be a decision time, to break above 1.3300 and aim for 1.3550, or go below 1.3185 and test 1.3000.
~~
Showing posts with label week homework. Show all posts
Showing posts with label week homework. Show all posts
Sunday, December 12, 2010

Sunday, December 05, 2010
EURUSD#13 - Weekly Homework
Euro formed a nice long hammer pattern on weekly chart last week. Though the huge black candle 2 weeks ago, thick Kumo managed to pull price back into the cloud again. That coincides with FB80 retracement for a run from 10 Sep to 4 Nov 2010.
A few resistances on the monthly chart:
1. Kijun & EMA50 - around 1.3550
2. Chikou has hit price action, will it break above it?
3. EMA50 for Chikou - around 1.3460
Support only around 1.3000
Resistances on the weekly chart:
1. Kijun for Chikou & EMA50 for price - around 1.3430
2. Kumo top - around 1.3550, also EMA50 for Chikou
3. Kumo bottom for Chikou - around 1.3800
No clear support other than 1.3000, which is also around Kumo bottom.
On the daily chart, price as break above EMA200 and into the Kumo. However, Friday's high is still inside a channel formed by the lower-highs and lower-lows since 4 Nov. It's still unclear whether it will break out from the channel, or being rejected by the Kumo and stay inside.
A few resistances:
1. EMA50 for both price and Chikou - around 1.3520
2. Kijun, also Chikou pivots - around 1.3625, also FB50 for recent downtrend
3. Kumo top - around 1.3830, also Kijun for Chikou
Supports:
1. EMA200 for Chikou - around 1.3320 to 1.3380
2. Kumo for Chikou - around 1.3180
4-hour chart, Chikou has break above price AND Kijun, showing some strength. Price action had also broken up into the cloud. If price manages to go above 1.3450 early Monday, then resistances are:
1. EMA200 - around 1.3520, near 1.3550 strong resistance
2. Kumo resistance for Chikou
Supports:
1. Kijun and Price action for Chikou
Could be a tricky week to trade. Long term trend still bearish, but if break above 1.3550, might go up further to 1.3830, a short term bull run. Bear run will continue once 1.3000 support is broken.
~~
A few resistances on the monthly chart:
1. Kijun & EMA50 - around 1.3550
2. Chikou has hit price action, will it break above it?
3. EMA50 for Chikou - around 1.3460
Support only around 1.3000
Resistances on the weekly chart:
1. Kijun for Chikou & EMA50 for price - around 1.3430
2. Kumo top - around 1.3550, also EMA50 for Chikou
3. Kumo bottom for Chikou - around 1.3800
No clear support other than 1.3000, which is also around Kumo bottom.
On the daily chart, price as break above EMA200 and into the Kumo. However, Friday's high is still inside a channel formed by the lower-highs and lower-lows since 4 Nov. It's still unclear whether it will break out from the channel, or being rejected by the Kumo and stay inside.
A few resistances:
1. EMA50 for both price and Chikou - around 1.3520
2. Kijun, also Chikou pivots - around 1.3625, also FB50 for recent downtrend
3. Kumo top - around 1.3830, also Kijun for Chikou
Supports:
1. EMA200 for Chikou - around 1.3320 to 1.3380
2. Kumo for Chikou - around 1.3180
4-hour chart, Chikou has break above price AND Kijun, showing some strength. Price action had also broken up into the cloud. If price manages to go above 1.3450 early Monday, then resistances are:
1. EMA200 - around 1.3520, near 1.3550 strong resistance
2. Kumo resistance for Chikou
Supports:
1. Kijun and Price action for Chikou
Could be a tricky week to trade. Long term trend still bearish, but if break above 1.3550, might go up further to 1.3830, a short term bull run. Bear run will continue once 1.3000 support is broken.
~~
Sunday, November 28, 2010
EURUSD#12 - Weekly Homework
EURUSD didn't go up as I thought, in fact it was almost all the way down, triggered by the tension at Korean Peninsula and Ireland debt crisis.
Last week's low 1.3198 was around FBR67 from September, so 1.3180 will be the immediate support for now.
On Ichi indicators, monthly, weekly and daily charts have all shown bearish signals.
On the 4-hourly chart, 1.3050 to 1.3080 might be the next support (chikou support), and then at 1.3000, which might also be a psychological support level.
There are some room for upward movement, with resistance at 1.3380 to 1.3400 (Daily Kumo bottom). Next resistance is 1.3480, if this resistance is breached then it might signals a short term bull trend that might hit 1.3750, with a few more resistances along the way (1.3550, 1.3630).
In a nutshell:
R3 1. 3550 (Daily Chikou support)
R2 1.3480 (Daily Chikou support)
R1 1.3380 to 1.3400 (Daily Kumo bottom)
S1 1.3180 (FBR67)
S2 1.3050 to 1.3080 (Chikou support)
S3 1.3000 (Chikou support)
~~
Last week's low 1.3198 was around FBR67 from September, so 1.3180 will be the immediate support for now.
On Ichi indicators, monthly, weekly and daily charts have all shown bearish signals.
On the 4-hourly chart, 1.3050 to 1.3080 might be the next support (chikou support), and then at 1.3000, which might also be a psychological support level.
There are some room for upward movement, with resistance at 1.3380 to 1.3400 (Daily Kumo bottom). Next resistance is 1.3480, if this resistance is breached then it might signals a short term bull trend that might hit 1.3750, with a few more resistances along the way (1.3550, 1.3630).
In a nutshell:
R3 1. 3550 (Daily Chikou support)
R2 1.3480 (Daily Chikou support)
R1 1.3380 to 1.3400 (Daily Kumo bottom)
S1 1.3180 (FBR67)
S2 1.3050 to 1.3080 (Chikou support)
S3 1.3000 (Chikou support)
~~
Sunday, November 21, 2010
EURUSD#11 Weekly Homework
After about 3 weeks of this and that travels, I am back and should pay more attention to the currency pairs again.
This might be an eventful week for Euro. With many important announcements to come, and also it's time to decide the monthly candle formation.
This month's candle formation is shaped by:
1. trend continuation from last month, but resistance found when Chikou bounced back by Kijun in the monthly chart.
2. down trend ever since.
3. slight rebound when supported by cloud in daily chart, and EMA200 and EMA50 in weekly chart.
My guess is Euro will be bullish for a couple of days, with immediate resistance at 1.3730 (4-hourly EMA200) to 1.3750 (4-hourly Chikou support). Another strong resistance is around 1.3865 (fbr 50 of recent downtrend. The pair might linger at that level if it does reach it.
However, if there's too much weakness for it to go up, immediate support at 1.3550 to 1.3590 (4-hourly Kijun). The next support, which might not be strong, at 1.3480, and another stronger one at 1.3381.
In a nutshell:
R3: 1.3910
R2: 1.3865 (fbr 50)
R1: 1.3730 (4-hourly EMA200) to 1.3750 (4-hourly Chikou support)
S1: 1.3550 to 1.3590 (4-hourly Kijun)
S2: 1.3480 (Chikou support)
S3: 1.3380 (daily EMA200, bottom of the cloud)
~~
This might be an eventful week for Euro. With many important announcements to come, and also it's time to decide the monthly candle formation.
This month's candle formation is shaped by:
1. trend continuation from last month, but resistance found when Chikou bounced back by Kijun in the monthly chart.
2. down trend ever since.
3. slight rebound when supported by cloud in daily chart, and EMA200 and EMA50 in weekly chart.
My guess is Euro will be bullish for a couple of days, with immediate resistance at 1.3730 (4-hourly EMA200) to 1.3750 (4-hourly Chikou support). Another strong resistance is around 1.3865 (fbr 50 of recent downtrend. The pair might linger at that level if it does reach it.
However, if there's too much weakness for it to go up, immediate support at 1.3550 to 1.3590 (4-hourly Kijun). The next support, which might not be strong, at 1.3480, and another stronger one at 1.3381.
In a nutshell:
R3: 1.3910
R2: 1.3865 (fbr 50)
R1: 1.3730 (4-hourly EMA200) to 1.3750 (4-hourly Chikou support)
S1: 1.3550 to 1.3590 (4-hourly Kijun)
S2: 1.3480 (Chikou support)
S3: 1.3380 (daily EMA200, bottom of the cloud)
~~
Monday, October 18, 2010
EURUSD#10 - Week Homework
Also a spinning top on weekly chart, which saw Chikou being rejected by EMA50 and Kijun after a bullish midweek run.
On the daily chart, price action had been steep for more than a month already. As wave target price was fulfilled, there's a high possibility of correction. 1.4185 might be a critical level, breaking which might mean continuation of bull run to the next resistance, in the region of 1.4485.
In a nutshell:
R3: 1.4485
R2: 1.4185
R1: 1.4055 (FB67, level wave target)
S1: 1.3910 to 1.3945 (Chikou support line)
S2: 1.3790 to 1.3840
S3: 1.3630 to 1.3660 (Chikou support line)
~~
On the daily chart, price action had been steep for more than a month already. As wave target price was fulfilled, there's a high possibility of correction. 1.4185 might be a critical level, breaking which might mean continuation of bull run to the next resistance, in the region of 1.4485.
In a nutshell:
R3: 1.4485
R2: 1.4185
R1: 1.4055 (FB67, level wave target)
S1: 1.3910 to 1.3945 (Chikou support line)
S2: 1.3790 to 1.3840
S3: 1.3630 to 1.3660 (Chikou support line)
~~
GBPUSD#17 - Weekly Homework
Yes, it did come down. But no, it didn't end the week as a black candle.
On the weekly chart, price action has broken above the previous high set back in August, but it actually didn't close above the previous high. The week ended with a spinning top. Still rather unsure! Chikou broke above EMA50, attempted to breach the cloud but failed. Take FB retracement from August 2009 and November 2009, two major resistances at FB67, which are 1.6110 and 1.6010, respectively.
On the daily chart, though a bearish antenna was formed, it's not wise to short this pair too aggressively to be safe, as Ichimoku indicators haven't give signals of weakness. Adventurous play though, can be to short it from 1.6065, with SL covering at least 1.6110.
4-hourly chart, also still bullish signals at least for the time being. However, with thin cloud ahead, a reversal can be rather sharp if it does happen.
In a nutshell:
R3: 1.6350 (FB80)
R2: 1.6110 to 1.6143 (FB67 and Chikou support)
R1: 1.6065
S1: 1.5945 (Chikou support)
S2: 1.5800 to 1.5830 (previous resistance turned support)
S3: 1.5570
~~
On the weekly chart, price action has broken above the previous high set back in August, but it actually didn't close above the previous high. The week ended with a spinning top. Still rather unsure! Chikou broke above EMA50, attempted to breach the cloud but failed. Take FB retracement from August 2009 and November 2009, two major resistances at FB67, which are 1.6110 and 1.6010, respectively.
On the daily chart, though a bearish antenna was formed, it's not wise to short this pair too aggressively to be safe, as Ichimoku indicators haven't give signals of weakness. Adventurous play though, can be to short it from 1.6065, with SL covering at least 1.6110.
4-hourly chart, also still bullish signals at least for the time being. However, with thin cloud ahead, a reversal can be rather sharp if it does happen.
In a nutshell:
R3: 1.6350 (FB80)
R2: 1.6110 to 1.6143 (FB67 and Chikou support)
R1: 1.6065
S1: 1.5945 (Chikou support)
S2: 1.5800 to 1.5830 (previous resistance turned support)
S3: 1.5570
~~
Sunday, October 10, 2010
EURUSD#9 - Weekly Homework
Gotta give more focus on Euro from now on.
Euro has been bullish for some time now. As Mentor pointed out, it will at least test the flat kumo bottom on the monthly chart. Now it doesn't only test, but actually break into the cloud. Tenkan-Kijun is till in bullish pattern on the monthly chart, but this doesn't give much meaning to short term intraday trades.
On the weekly chart, however, Tenkan-Kijun shows bullish sentiment, albeit is arguably a weak one (crossed below the cloud).
On the daily chart, the price action has gone to far above the cloud. This is when PW comes into play to determine wave targets.
In a nutshell:
R3: 1.4180
R2: 1.4030 to 1.4050 (Last week's high, fb66 retracement, level wave targets)
R1: 1.3945 (Chikou support line on weekly chart)
S1: 1.3790 to 1.3840 (last week's support range in smaller time frame
S2: 1.3630 to 1.3660 (last week's low, Chikou support line)
S3: 1.3330 to 1.3380 (current bull run's 50% retracement)
Personally I don't t expect it to go too much above 1.4050 resistance before it comes down to the range of 1.3330 to 1.3380. However, if it 1.4180 is broken, next target might be 1.4485.
~~
Euro has been bullish for some time now. As Mentor pointed out, it will at least test the flat kumo bottom on the monthly chart. Now it doesn't only test, but actually break into the cloud. Tenkan-Kijun is till in bullish pattern on the monthly chart, but this doesn't give much meaning to short term intraday trades.
On the weekly chart, however, Tenkan-Kijun shows bullish sentiment, albeit is arguably a weak one (crossed below the cloud).
On the daily chart, the price action has gone to far above the cloud. This is when PW comes into play to determine wave targets.
In a nutshell:
R3: 1.4180
R2: 1.4030 to 1.4050 (Last week's high, fb66 retracement, level wave targets)
R1: 1.3945 (Chikou support line on weekly chart)
S1: 1.3790 to 1.3840 (last week's support range in smaller time frame
S2: 1.3630 to 1.3660 (last week's low, Chikou support line)
S3: 1.3330 to 1.3380 (current bull run's 50% retracement)
Personally I don't t expect it to go too much above 1.4050 resistance before it comes down to the range of 1.3330 to 1.3380. However, if it 1.4180 is broken, next target might be 1.4485.
~~
Sunday, October 03, 2010
GBPUSD#16 - Weekly Homework

[Weekly Chart]
A doji was formed last week, also saw Chikou failed to break above flat Kijun. It also closed just below fb80 from August's high. Probably a sign of another XAB is formed. Generally, weekly sentiment is a little unsure.

[Daily Chart]
As Trading Buddy pointed out, no candle manage to close above 1.5833 level (week Flat Kijun). Those long candle shadows indicate uncertainty and tug-of-war between the bull and the bear, with bear appear to be slightly stronger for now. However, the last candle was a bullish engulfing.

[4-hourly Chart]
Just to further zoom in to see the uncertain trend. Even Tenkan is overlapping right on the Kijun now.
In a nutshell:
Uncertain trend, with many supports and resistances to watch out for. Sentiment is more bearish-inclined until the previous high (1.5997) is broken.
R2 - 1.5997 (previous high)
R1 - 1.5920 to 1.5945 (last week's high, previous Chikou support)
C - 1.5800 to 1.5833 (4H Chikou support and Weekly Kijun flat)
S1 - 1.5665 (last week's low0
S2 - 1.5570
~~
Sunday, September 12, 2010
GBPUSD#15 - Weekly Homework
Weekly chart has seen candle come out of the cloud. It seems retracement is not yet complete for a bullish motive wave from end of May to the beginning of August. Weekly candle closed slightly below FB33 retracement and back into the downward channel again, might go down further to test FB50 retracement (1.5115) which coincides with Kijun-sen, or the bottom of the cloud on the daily chart (1.5170).
Currently price is in a range between 4-hourly EMA200 and a support range between 1.5290 and 1.5350.
R2 - 1.5520 (previous support-turn-resistance)
R1 - 1.5460 (4-hourly Kumo Top) or 4-hourly EMA200
S1 - range between 1.5290 and 1.5350
S2 - range between 1.5170 (daily kumo bottom) and 1.5115 (fb50 retracement)
~~
Currently price is in a range between 4-hourly EMA200 and a support range between 1.5290 and 1.5350.
R2 - 1.5520 (previous support-turn-resistance)
R1 - 1.5460 (4-hourly Kumo Top) or 4-hourly EMA200
S1 - range between 1.5290 and 1.5350
S2 - range between 1.5170 (daily kumo bottom) and 1.5115 (fb50 retracement)
~~
Sunday, September 05, 2010
GBPUSD#14 - Weekly Homework

[Monthly Chart]
Last month finished forming a dark cloud. This month, after over 3 trading days, looking to be forming the top shadow of a black candle? Too early to say anyway.

[Weekly Chart]
It has been 3 consecutive weeks of rather small range, and small body. though it's been making a slow down trend, short bodies might signifies uncertainties. Anyway, it's broken below EMA50, being supported by Kumo Bottom.

[Daily Chart]
Price has been moving in a bearish channel. However, a bullish cloud is immediately ahead. Price might enter Kumo and bounce up.

[4-hourly Chart]
EMA50 continues to be the trend definition since August.
In a nutshell:
R2 - 1.5576 (previous week high)
R1 - 1.5520 (previous support turned resistance)
S1 - 1.5325 - 1.5340 (previous week low)
S2 - 1.5170 (daily chart kumo bottom)
EMA200 and EMA50 are always helpful indicators of support and resistance too.
~~
Sunday, August 22, 2010
GBPUSD#14 - Weekly Homework

[Monthly Chart] - GBPUSD is making up a dark cloud cover pattern this month. with 7 to 8 trading days remaining in August, I do not expect it to reverse the formation. There's no big figures pending this week that might drive it up so drastically. Which also means, no big figure from the UK itself to crash it down violently?

[Weekly Chart]

[Daily Chart]
Last week has been trading within in a tight range, with 1.5550 being a very solid support, until the last day. The week closed with a black candle closing below the S1 mentioned last week, though being supported by S2, and EMA50. On weekly chart, Chikou has bounced back by price action.

[4-hourly Chart]
EMA200 support has been very solid (more so on Netdania chart). Thick bearish Kumo ahead.
In a nutshell:
S1 - EMA200 on 4-hourly Chart
S2 - 1.5460 (last week's low) to 1.5433 (daily EMA200)
S3 - 1.5340 (weekly Kumo bottom)
R1 - 1.5550 (previous support)
R2 - 1.5622 (or 4-hourly EMA50)
R3 - 1.5769 (4-hourly Kumo top)
General sentiment is bearish, with daily EMA200, and then EMA50, being crucial supports. Breaking R3 (1.5769) might mean an end to current bearish sentiment and might go for 1.6000 region.
~~
Sunday, July 25, 2010
EURUSD#8 - Weekly Homework

[30m Chart]
If I were to trade early movement, short at 1.2915 to 1.2929, SL 40 to 50 pips, first target around 1.2835. Second target around 1.2795. SL should be able to cover previous high of 1.2964.

[Daily Chart]
From what I can see TODAY:
S1 ~ 1.2835
S2 ~ 1.2795
S3 ~ 1.2735, then 1.2690
R1 ~ 1.2965
R2 ~ 1.3025
R3 ~ 1.3090
~~
Monday, July 12, 2010
GBPUSD#11 Weekly Homework

In the daily chart, GBPUSD seems to be moving within a range with last week's high and low as boundaries. There's a good chance it might continue to move in that pattern in the early week. As Trading Buddy said, it might be good chance to play within the S&R range.
It may still hit the high of between 1.5240 (fb80 from Big White B) and 1.5270 (Big Red L1 target).

Look at the 4-hourly chart, even though the price has been bouncing above the cloud last week, but last week's close saw Chikou finally broken below the price. It's a weak bearish sign because it cross the price above the cloud. Another reason to think it will go sideway.
Another scenario is, the price to drop to the flat top of the cloud (around 1.4870, also fb67 from last week's high in the daily chart), or flat kijun (around 1.4795, or fb50 retracement from bigger wave from the low of 8 June), before going up. Can look for chance to long at these 2 regions.
A good place to short will be EMA200 in the daily chart, around 1.5400. Shall observe more in the coming week.
~~
EURUSD#7 Weekly Homework

Last week EURUSD had retraced up beyond fb33 level, but just below fb50. For bigger trend, expect it to touch fb50 anyway.
In a daily chart, the flat top of the cloud can be a strong resistance against an uptrend. Can look out for short opportunities at 1.28 region. However, if price closed above the flat top, bullish trend will continue to 1.31 (fb67), even 1.33 (fb80). When price ever hit 1.33, a reversal might soon take place.
For shorter term play, first to watch out for short at 1.2690, SL 30 - 40 pips, TP 1.2480.
Long position can be at EMA200 of 4H chart, around 1.2460, or trendline at 1.2400.
p/s: Trading buddy, finally ripple got update, thanks for constant encouragement, haha. Had one winning and one losing trade in the past week, there's a big room for improvement.
~~
Sunday, June 27, 2010
AUDUSD#7 - Weekly Homework
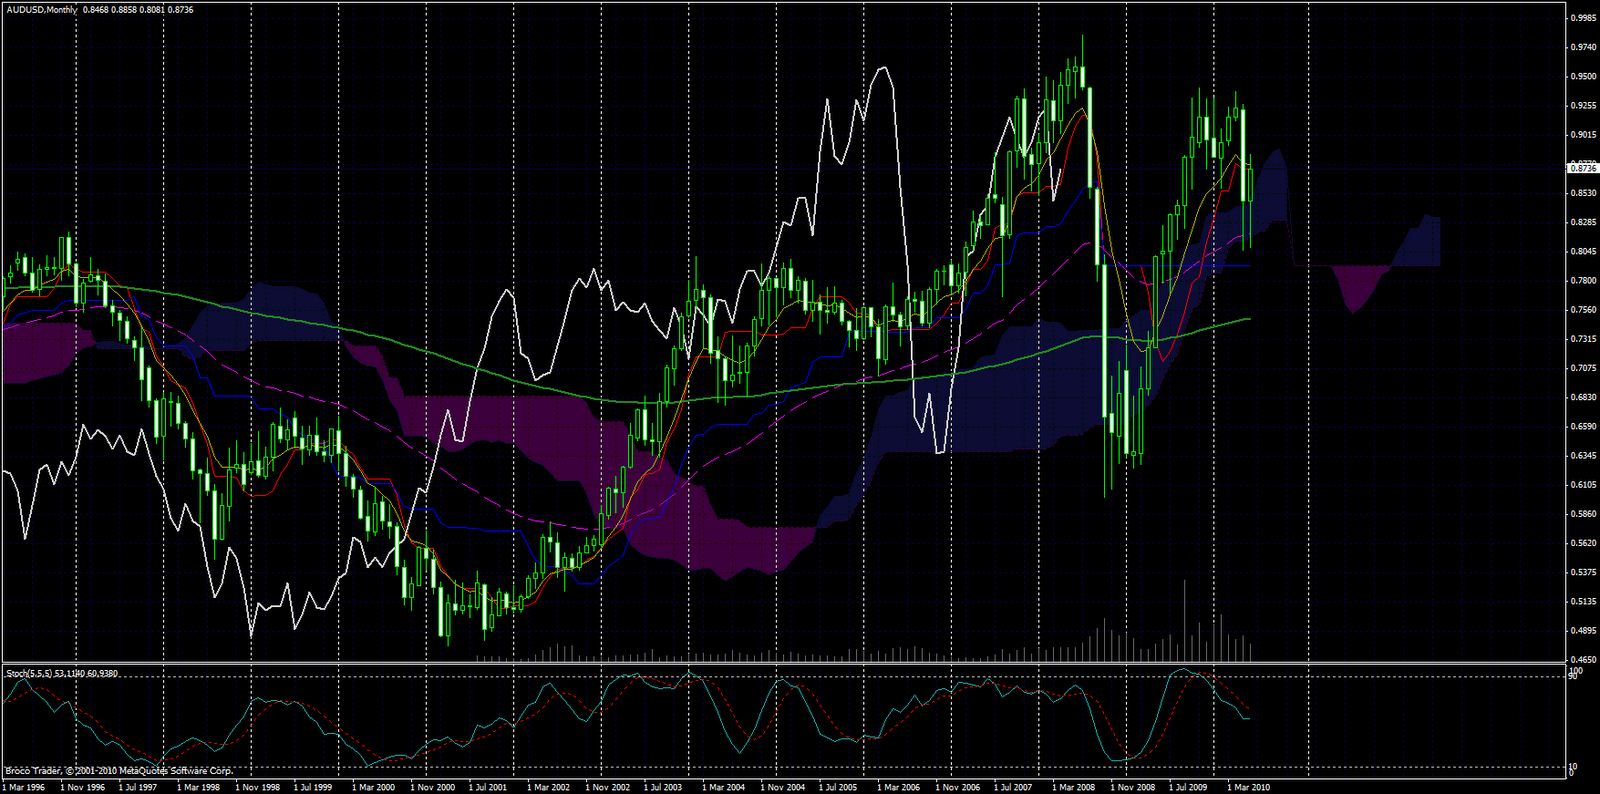
[Monthly Chart]
Cloud has been good support in the monthly chart. Good chance this month will close above the cloud.

[Weekly Chart]
A brief bullish run at the end of last week didn't manage to push the price to close above the cloud, so near term uptrend is yet to be confirmed.

[Daily Chart]
Monday's movement is crucial to determine the immediate direction:
1. If it closed above the flat top of the cloud (also around EMA200), wait for retracement to long, with WTP around 0.9020, where the Big Red K is. But a reasonable SL should be last week's low, which is too big for day trade :-S Another SL option is around 0.8690, which is where Chikou might hit flat Kijun, but then...how valid is that SL?
2. If closed back into the cloud, use Chikou and flat Kijun's interaction for short entry. SL is big again, last week's high (0.8858). Another option is EMA200 (0.8762). WTP to be calculated based on wave formation.
3. Two possibilities of double-top reversal, at 0.8858 and between 0.9025 to 0.9076. Observe lower time frame candles for possible short entry.

[4-Hourly Chart]
Looking at the 4H chart, the bullish cloud is thinning, a downtrend is possible
~~
EURUSD#6 - Weekly Homework

EMA200 is being good support in the monthly chart. 3 more trading days before July, so far it is a hammer pattern. How will it close this month?
I attended the TA Weekly Meeting at IIC for the first time. There I learned to mark Support & Resistance using current and previous month's highs and lows. There are 3 lines for reference now, 1.2466, 1.2142 and 1.1875.

On a daily chart, Big Blue C2 is being labeled tentatively, which is about fb33 retracement. However, the bullish sentiment from last week might sustain and continue to move up and break 1.2466 (C2). Reasons to call it bullish:
1. Price closed above flat Kijun for 3 days already, Kijun might be a good support for now
2. Tenkan-Kijun cross in daily chart
3. Price above the cloud on the 4H chart, and the cloud seems to be thick enough as a good support for going up for a while

[4-hourly Chart]

1. EMA200 on 4H chart, about 1.2400
2. Last week's high, about 1.2466, where a double top is to be formed
3. fb33 retracement of Big Blue C1, about 1.2480
If all these resistances were breached, uptrend is confirmed, then the immediate WTP is 1.2611, which is 2x A, about the bottom of the cloud on the daily chart. However, a strong bull might run up to 1.2785 region, which is 3x A, fb50 retracement of the Big Blue C1, Chikou meets Kijun and the flat top of the cloud on the daily chart.
If the resistances cannot be broken, then price might fall back to about 1.2272, which is about the flat Kijun on the daily chart, stay inside the cloud on a 4H chart, and a downtrend might happen after that.
When that happens:
1. Downtrend starts when price closes outside the cloud on the 4H chart, meaning Chikou breaks below the price as well. Chance for short entry when price retraces up to around 1.2250, with SL in the range of 40pips.
2. As mentioned at the beginning of this post, a support at 1.2142, which is the low of the previous month. So price might bounce up from this level, a possible formation of Big Blue J wave, a K might then be formed at the flat cloud region on a 4H chart below (blue rectangle)

[4-hourly Chart]
Conclusion:
1. The trend for the coming week is rather uncertain. Several resistance levels to be broken for the uptrend to be confirmed, but a reasonable SL will be rather big. Unless a better SL region can be identified, a long trade is quite risky at the moment.
2. Watch out for reversal pattern on 4H chart if price does move up to around 1.2466 region, when double top is formed. SL in the range of at least 30pips.
3. If price doesn't move up, a short is possible when price closes outside the cloud on the 4H chart. Use cloud, Kijun and Chikou to determine SL. Possible downward resistance is 1.2142.
~~
Monday, June 21, 2010
GBPUSD#9 - Weekly Homework

I believe Red C2 retracement is not done yet, though last week it briefly touched a fb67 from the high of 1.4886.
In day chart, an antenna was formed. Chances of going down on Monday is high. Immediate target is EMA200 on 4H chart (1.4713), 1.4676 (fb67). J, K will build up after that.
However, if it opens and breaks above last week's high, the next target is around 1.5109, the first possibility of forming a Big Green L2.
~~
Thursday, June 17, 2010
GBPUSD#8 - Stopped Out

I entered this trade as planned. Shorted it when it closed outside the cloud again. But a quick and sharp reversal happened soon after that.
When I got stopped out, it was actually a nice reversal pattern formed, but didn't go for it as I thought I should not react so impulsively.
One thing about the entry was, the Chikou did not break and close below the cloud. So it wasn't a very safe entry in fact.
~~
Sunday, June 13, 2010
GBPUSD#5 - Weekly Forecast

Strictly speaking, from day chart, Big Lime L1 is not finished yet, about 20pips short of WTP. But, technical analysis is more of an art than science isn't it? Let's see.

By the way, White R, S still valid. Kijun-sen is also still valid in day chart, to reject the upward movement. The same is true in 4H chart.

4H chart, Tenkan had crossed above Kijun last week, so a short term uptrend can be expected.
Chikou is between Kijun flat and price. Immediate resistance might be Kijun flat, which is fb67 retracement of the previous downward rally. Resistance levels:
1. 1.4590, fb67 retracement, Chikou meet Kijun flat in 4H chart
2. 1.4630, fb50 retracement, Chikou might move near top of the cloud in 4H chart, and also flat Kijun in 1H chart.
3. 1.4700, fb80 retracement, EMA200 in 4H chart
1H chart, price is moving along the cloud bottom, so any price close outside the cloud bottom will be a sign of going down.
Shall look out for reversal sign. If market started out bullish, I expect GBPUSD to take a short ride up before coming down. I think it has little upside, but plenty of room for bear run.
Looking at week chart, it seems it's rather unsure of its own direction? Be very careful, it can go anywhere!
~~
AUDUSD#2 - Weekly Forecast

AUDUSD pair had proved several of my analyses wrong last week. Though it did hti the small blue C1 target (TP was 0.8159), but anything after that was out of my plan. It broke the small blue B, so it's invalid now, though technically I can still call it within Red S wave.
However, looking at weekly chart, EMA200 has been very solid in supporting the downward trend for 4 weeks in a row. Furthermore, it closed with a big solid white candle last week. So, the chances of re-forming Big Red L2 is rather high this week.

If last week's upward momentum sustains, then expect it to move up in the blue channel. If it moves out of it, perhaps it's a sign of weakness. Another indication of uptrend is, tenkan crossed up kijun and above the cloud, as my trading buddy puts it. Trend might remain bullish unless Tenkan-sen crosses down Kijun in the near future.
Three levels of TPs:
1. around 0.8540, which is fb50 retracement of Big Red L1, also the current Big Red L2
2. around 0.8590, EMA200 in 4H chart, also about Kijun in day chart
3. around 0.8700, fb67 retracement
4. around 0.8830, fb80 retracement
5. around 0.9020, fb100, also a C1 WTP if a new x is started on 25 May
Anyway, I shall always observe the market movement. I believe a beginner like me shall behave like a ripple in the wave - always watch the surrounding, a way to build up accuracy.
~~
Subscribe to:
Posts (Atom)