Sunday, June 27, 2010

AUDUSD#7 - Weekly Homework


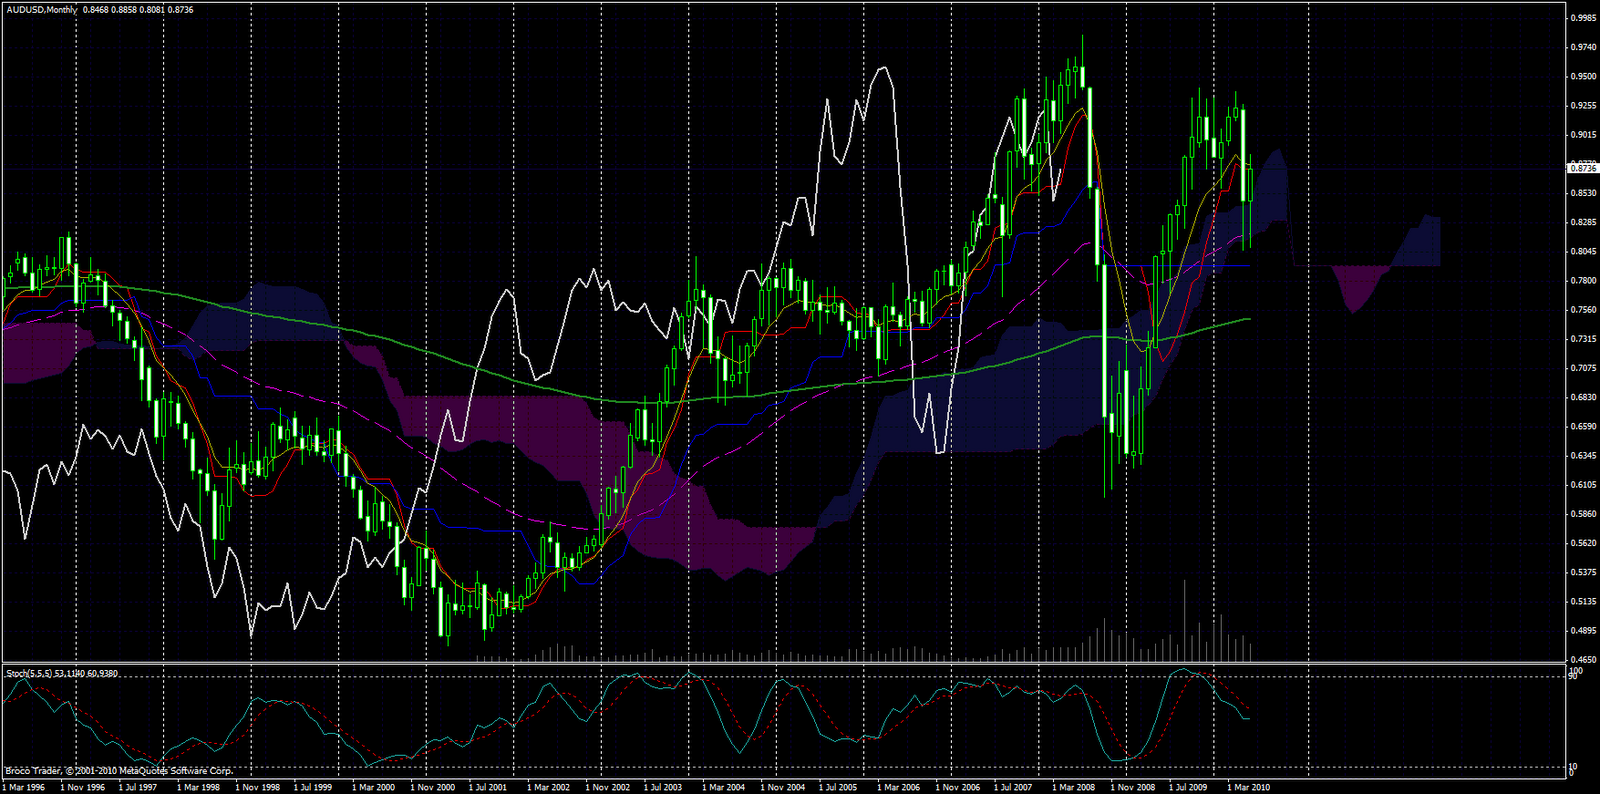
[Monthly Chart]

Cloud has been good support in the monthly chart. Good chance this month will close above the cloud.


[Weekly Chart]

A brief bullish run at the end of last week didn't manage to push the price to close above the cloud, so near term uptrend is yet to be confirmed.


[Daily Chart]

Monday's movement is crucial to determine the immediate direction:

1. If it closed above the flat top of the cloud (also around EMA200), wait for retracement to long, with WTP around 0.9020, where the Big Red K is. But a reasonable SL should be last week's low, which is too big for day trade :-S Another SL option is around 0.8690, which is where Chikou might hit flat Kijun, but then...how valid is that SL?
2. If closed back into the cloud, use Chikou and flat Kijun's interaction for short entry. SL is big again, last week's high (0.8858). Another option is EMA200 (0.8762). WTP to be calculated based on wave formation.
3. Two possibilities of double-top reversal, at 0.8858 and between 0.9025 to 0.9076. Observe lower time frame candles for possible short entry.


[4-Hourly Chart]

Looking at the 4H chart, the bullish cloud is thinning, a downtrend is possible

~~

EURUSD#6 - Weekly Homework


[Monthly Chart]

EMA200 is being good support in the monthly chart. 3 more trading days before July, so far it is a hammer pattern. How will it close this month?

I attended the TA Weekly Meeting at IIC for the first time. There I learned to mark Support & Resistance using current and previous month's highs and lows. There are 3 lines for reference now, 1.2466, 1.2142 and 1.1875.


[Daily Chart]

On a daily chart, Big Blue C2 is being labeled tentatively, which is about fb33 retracement. However, the bullish sentiment from last week might sustain and continue to move up and break 1.2466 (C2). Reasons to call it bullish:

1. Price closed above flat Kijun for 3 days already, Kijun might be a good support for now
2. Tenkan-Kijun cross in daily chart
3. Price above the cloud on the 4H chart, and the cloud seems to be thick enough as a good support for going up for a while


[4-hourly Chart]


[Hourly Chart]

There are several resistances to consider:

1. EMA200 on 4H chart, about 1.2400
2. Last week's high, about 1.2466, where a double top is to be formed
3. fb33 retracement of Big Blue C1, about 1.2480

If all these resistances were breached, uptrend is confirmed, then the immediate WTP is 1.2611, which is 2x A, about the bottom of the cloud on the daily chart. However, a strong bull might run up to 1.2785 region, which is 3x A, fb50 retracement of the Big Blue C1, Chikou meets Kijun and the flat top of the cloud on the daily chart.

If the resistances cannot be broken, then price might fall back to about 1.2272, which is about the flat Kijun on the daily chart, stay inside the cloud on a 4H chart, and a downtrend might happen after that.

When that happens:

1. Downtrend starts when price closes outside the cloud on the 4H chart, meaning Chikou breaks below the price as well. Chance for short entry when price retraces up to around 1.2250, with SL in the range of 40pips.
2. As mentioned at the beginning of this post, a support at 1.2142, which is the low of the previous month. So price might bounce up from this level, a possible formation of Big Blue J wave, a K might then be formed at the flat cloud region on a 4H chart below (blue rectangle)


[4-hourly Chart]

Conclusion:
1. The trend for the coming week is rather uncertain. Several resistance levels to be broken for the uptrend to be confirmed, but a reasonable SL will be rather big. Unless a better SL region can be identified, a long trade is quite risky at the moment.
2. Watch out for reversal pattern on 4H chart if price does move up to around 1.2466 region, when double top is formed. SL in the range of at least 30pips.
3. If price doesn't move up, a short is possible when price closes outside the cloud on the 4H chart. Use cloud, Kijun and Chikou to determine SL. Possible downward resistance is 1.2142.

~~

Thursday, June 24, 2010

AUDUSD#6 - Position


Big Red L2 seems to be formed now, and a J wave down is on the way.

Now I label again a new small yellow xab from Big Red L2. It seems it's half way C1 now, but there are always opportunities for entries when retracements happen.

Before badminton, the price was hovering around 0.8730 but seemingly on the up. I placed a sell order at 0.8750, which is about the bottom of the cloud and above the Kijun-sen on 1H chart. SL was rather big, just above the cloud. Target price is 0.8735, slightly above 4H EMA200. Small yellow c1 TP is 0.8619.

When I return from badminton games, I was then in the trade, with a little floating profit. (Another sell order for EURUSD wasn't done)

Saw a hammer pattern on 1H chart, was thinking about closing trade and wait for re-entry? Set trailing stop? Move SL? Closing the trade was rather tempting, but in the end I decided against it because:

1. TP is 0.8635, and the plan is still intact
2. It might be just yet another retracement on the way down, with lower-highs being formed along the way.
3. I should try to stick to my plan as my mentor told me (note: however, how do I know my plan good enough?) and pick up more lessons throughout

Finally, as of time of posting, I've moved my SL to 0.8765, day high, and also around the trend line. But my floating profit is only 25 pips now.

Let's see what happen next.

p/s: England won, with much better football this time but still rather dull. The Americans' spirited performance won them a deserved victory and qualification to the Round of 16.


~~

Wednesday, June 23, 2010

EURUSD#5


Can say Big Blue J is formed, awaiting a K retracement? Will watch out around 1.2355. But looking at a slightly bigger picture, on 4H chart, there's a bullish cloud ahead, it takes big bang to pierce the thick cloud.

Perhaps a new J should be formed, before it bounces up the cloud in the 4H chart.

On the day chart, Tenkan is turning up approaching Kijun. If they cross, current C2 might have to be rewritten.

Should I call myself timid, conservative, or downright UNSURE? Hm...I am not even sure of the answer... LOL

~~

AUDUSD#5


Sidewalk continues. Though a good S/R trader might have made a handsome profit, but I'm still on the sideline. On 1H chart, the price is now below the Tenkan-sen and Kijun-sen after a long while. 0.8800 appears to be a good resistance for now. But I haven't got a convincing reason to trade :-S

~~

Monday, June 21, 2010

AUDUSD#4 - wait

My trading buddy has always been studying this pair.


From 4H chart, Tenkan-sen still moving above Kijun-sen. So it remains bullish for the time being, though the big gap-up today is waiting to be closed some time.

It's currently at fb80 retracement from the Big Red L1 down wave. A reversal can just happen anytime, confirmation will be Tenkan-Kijun crossing.


No bearish cross of Tenkan-Kijun in 1H chart as well.


Tenkan is crossing Kijun at the time of writing, but doesn't look like a steep and convincing cross.

Wait.

~~

GBPUSD#10 - Day Homework


After breaking a little above last week's high, GBPUSD is on course for a fb67 retracement from recent high. Don't expect it to move tamely to TP of 1.4710 though.

~~

Feedback

"The real world is a feedback mechanism. When you climb on the bathroom scale and find you are twenty pounds overweight, that is feedback. if you are fired, broke, or divorced, that, too, is feedback...unfortunately, many ... don't accept or learn from the feedback they receive..."
-- Robert T. Kiyosaki

confusion in making trading plans is a feedback
not being able to see a clear direction is a feedback
shrinking fund size is a feedback
feeling lack of confidence is a feedback
can't understand what other traders are talking about is a feedback

likewise,
being able to read the market movement is a feedback
market movement well within your prediction is a feedback
increasing fund is a feedback

Life's full of feedback in one form or another, but they are useless if you can't make use of them to work for your benefit.

~~

GBPUSD#9 - Weekly Homework


I believe Red C2 retracement is not done yet, though last week it briefly touched a fb67 from the high of 1.4886.

In day chart, an antenna was formed. Chances of going down on Monday is high. Immediate target is EMA200 on 4H chart (1.4713), 1.4676 (fb67). J, K will build up after that.

However, if it opens and breaks above last week's high, the next target is around 1.5109, the first possibility of forming a Big Green L2.

~~

Thursday, June 17, 2010

GBPUSD#8 - Stopped Out


I entered this trade as planned. Shorted it when it closed outside the cloud again. But a quick and sharp reversal happened soon after that.

When I got stopped out, it was actually a nice reversal pattern formed, but didn't go for it as I thought I should not react so impulsively.

One thing about the entry was, the Chikou did not break and close below the cloud. So it wasn't a very safe entry in fact.

~~

GBPUSD#7


GBPUSD hit TP of 1.4854 last night and started to come down immediately.

A possible retracement is FB67, where Chikou is going to hit the bottom of the cloud and around EMA200 on 1H chart. It's also 20 pips below flat Kijun on 4H chart. Shall watch out for the market direction around that region.

Plan:
1. If 1H price bounces up to 1.4703 (EMA200 on 4H), wait for price to close outside cloud to short, TP 1.4655. But I'll have to see then where a reasonable SL should be, and calculate the possible risk:reward ratio. A no go if it's less than 1:2

2.If price fall to 1.4655, watch out closely if it shows sign to bounce up or going further down. For short, SL around EMA200 on 1H chart, TP 1.4555.
 

~~

AUDUSD#3 - Sidewalking


AUDUSD has been bullish. In fact, everything has been bullish since last week.
However, AUDUSD is sidewalking at the moment. A ceiling resembling a triple top is being formed now. It will make a decision again. Support and Resistance (S&R) traders will like this kind of pattern very much? Join the ride when it breaks from the ceiling or floor, with SL placed rather tightly back into the S&R region. From the history, this kind of trade will require quite an amount of monitoring as the reward can be small (though windfalls happened at times).

~~

Wednesday, June 16, 2010

Range

Got one reminder from my fellow trading buddy today, that market can go in any of the three directions: up, down, flat. So, how to plan a trade? Study the chart and find a range, higher than which will mean a uptrend and vice versa. Will it work? I'll try...

~~

Monday, June 14, 2010

GBPUSD#6 - Question: What is Reversal?


I am always confused, how to define reversal? Then I recall Ayumi had a similar doubt. After re-reading the table quoted from Investopedia, I'm still wondering.

While it's easy to always assume market moves in my preferred direction. At this moment, I just think everything is going down. But to be a trader, it's important to "trade what you see, not what you think!"

Some traders were already calling for an uptrend of some pairs like EURUSD and GBPUSD, while I was thinking anything that goes up is merely "retracement".

But after seeing EURUSD and GBPUSD running loose like bulls, I was left wonder, what should my strategy be?

From the area highlighted blue in the chart above, should I call it a retracement from what I labeled White L1? Even yes, should I trade against the major trend, i.e. trading the reversal?

If the retracement wave is a big one (across at least 1 or 2 weeks), what's the pros and cons of trading the retracement?

Trading a retracement wave of a 4H chart or less might be strenuous, requires much attention, what about something larger than that?

Another point to ponder.

~~

Remember the F Chord Experience

Had a short talk with my mentor. I complained about difficulty in seeing a clear trend of the market.

Not that I expect myself to be seeing trends like a pro anytime now, but, just a vent of frustration.

While talking, I reminded myself of my guitar learning journey when I was back in middle school.

If you ever learned guitar, you might agree that the first major hurdle to overcome was getting the F Major Chord right. You must have cursed and grumbled on numerous occasions when you had to press 2 strings firmly with only your index finger!

Many people, including myself, had tried to find ways round it - use two different fingers for different strings, skipping one of the strings, or skip learning the chord even guitar altogether! But after a few futile attempts, I came to realise that there's NO way round it. If here was, someone would have thought about it some decades ago.

Just like in a hurdle race, the first major hurdle can be the finishing line for many. But for those who had leaped over it, they would gain momentum, confidence, and pace. No smooth run after that, more hurdles to come, but they don't appear as difficult as the first one.

I have no problem with F Chord now of course. If any beginner comes to me asking how to learn F Chord? The only answer is, practice! I guess that's the magic word I'll get if I were to ask "how to see market more clearly?" Having said that, predicting the market trend is just the first hurdle. More to come. Will they appear less difficult than the first one? Maybe not.

Pat on my own shoulders and say, "Jia You!"

~~

Sunday, June 13, 2010

GBPUSD#5 - Weekly Forecast


Strictly speaking, from day chart, Big Lime L1 is not finished yet, about 20pips short of WTP. But, technical analysis is more of an art than science isn't it? Let's see.


By the way, White R, S still valid. Kijun-sen is also still valid in day chart, to reject the upward movement. The same is true in 4H chart.


4H chart, Tenkan had crossed above Kijun last week, so a short term uptrend can be expected.
Chikou is between Kijun flat and price. Immediate resistance might be Kijun flat, which is fb67 retracement of the previous downward rally. Resistance levels:
1. 1.4590, fb67 retracement, Chikou meet Kijun flat in 4H chart
2. 1.4630, fb50 retracement, Chikou might move near top of the cloud in 4H chart, and also flat Kijun in 1H chart.
3. 1.4700, fb80 retracement, EMA200 in 4H chart

1H chart, price is moving along the cloud bottom, so any price close outside the cloud bottom will be a sign of going down.

Shall look out for reversal sign. If market started out bullish, I expect GBPUSD to take a short ride up before coming down. I think it has little upside, but plenty of room for bear run.

Looking at week chart, it seems it's rather unsure of its own direction? Be very careful, it can go anywhere!

~~

AUDUSD#2 - Weekly Forecast


AUDUSD pair had proved several of my analyses wrong last week. Though it did hti the small blue C1 target (TP was 0.8159), but anything after that was out of my plan. It broke the small blue B, so it's invalid now, though technically I can still call it within Red S wave.

However, looking at weekly chart, EMA200 has been very solid in supporting the downward trend for 4 weeks in a row. Furthermore, it closed with a big solid white candle last week. So, the chances of re-forming Big Red L2 is rather high this week.


If last week's upward momentum sustains, then expect it to move up in the blue channel. If it moves out of it, perhaps it's a sign of weakness. Another indication of uptrend is, tenkan crossed up kijun and above the cloud, as my trading buddy puts it. Trend might remain bullish unless Tenkan-sen crosses down Kijun in the near future.

Three levels of TPs:
1. around 0.8540, which is fb50 retracement of Big Red L1, also the current Big Red L2
2. around 0.8590, EMA200 in 4H chart, also about Kijun in day chart
3. around 0.8700, fb67 retracement
4. around 0.8830, fb80 retracement
5. around 0.9020, fb100, also a C1 WTP if a new x is started on 25 May

Anyway, I shall always observe the market movement. I believe a beginner like me shall behave like a ripple in the wave - always watch the surrounding, a way to build up accuracy.


~~

Technical Forecasting

My mentor says to be a successful trader, one has to be well equipped in 3 major aspects - technical, psychology, and risk management.

Technical analysis and forecasting are something that one can learn, through books, teachings, lectures, etc. The same is true for risk management. There are theories to be learned, and it's up to one to apply what he had learned. The biggest obstacle is always the psychology part. It can only be learned through one's own journey and experience - trips and tumbles, though advices and sharing from others can help to reduce the steepness of the learning curve.

Yes, these are all right.

But I was wrong in thinking the technical part is not too difficult, or rather just a small part out of the three.

Last week, I was amazed by how accurate others could forecast the price action, almost to the pip-accurate precision.

I know I'm still an infant in this Live! world. Like my mentor said, I'm only a first week student in a degree course, why am I thinking to write a graduate thesis already? There are so much to grasp and observe. I'm glad I'm not alone on this journey, that I can learn this field with my trading buddies and mentor. With the availability of opportunities and information around, it's really up to one's desire to decide how much he wants to learn, and at what pace. Of course, talents always play some part in.

Pat on my own shoulders and say, jia you!

GBPUSD #4 - First Try of Using Open Order


In 4H chart, after price action bounced up after hitting cloud bottom, I was always looking out for a reversal sign (note: again, was I biased??). I identified several possibilities of resistance:

1. 2/3 retracement, approx. 1.4608
2. Top of cloud, approx. 1.4630
3. 80% retracement, approx 1.4661
4. EMA200 on 4H chart

While observing price action around the first few options, there were no clear sign of weakness (although it always showed a few fake moves). Finally I thought it should not break the EMA200, and even it does, won't be by a big margin, else it would be break the small white x. So, I placed an open short order around EMA200.

When I wake up, there wasn't anything in my "Open Position" window. But that was just because my order had been matched, and SL triggered T_T

Lesson learnt? Hm...I don't think it's so wise for a beginner like me to put an open order just like that? Not until I can forecast the market rather better.

By the way, I didn't fail to notice a nice reversal sign on 4H chart, a Dark Cloud Cover was formed! But due to technical problems, I couldn't place an order -.-

~~

GBPUSD#3 - Winning but Not Satisfying Trade


As planned in the very beginning of last week, was expecting GBPUSD to form a Big White R, S waves before T extension. Also, forecast GBPUSD to go up slightly before continuing it's rally down.

However, it happened quite the opposite - dropped a bit at the beginning of the week before a bullish run up.

As labeled in the 1H chart above, I entered the trade after the Dark Cloud Cover reversal pattern, predicting it might be the end of S wave and start of T.

It went down as predicted, and of course I was glad.


I woke up the next morning with rather satisfying (for me level) 60-odd pips. But as now shown on the chart, it was a strong bull run for 2 days. Though I didn't get my SL triggered, but I exited the trade with less than 20 pips of profit. Of course any profit can't be bad, but as a review, I think I should have exited from the trade when 4H chart showed the downward action was disrupted when the candle break the bottom of the cloud but closed as a white candle way inside the cloud. It was a sign of weak bear.

Lesson learnt.


~~